
Guest history: up to 30 sessions
Review recent median reaction time, false starts, and input method separately for each sample size.
Free Browser Tool
Wait for one unpredictable visual signal, then tap, click, or press as quickly as you can. Choose 1 to 10 measured trials and review your median, average, fastest response, and response spread.
The exercise runs entirely in your browser and requires no account. It is a practice task, not a medical, neurological, driving-safety, sport, or gaming assessment.
Reaction time varies from one attempt to the next. For guests, the History button keeps recent sessions and personal bests in this browser. Signed-in users can review supported results in account history. Compare the same sample size for a steadier view.
Review recent median reaction time, false starts, and input method separately for each sample size.
Compare each completed session with your fastest local median for the same number of trials.
Guest history stays in this browser and is not sent to analytics. When signed in, supported result summaries are saved to your Quartenson account, not to analytics or advertising services.
For useful comparisons, keep the same device, browser, input method, and sample size.
Use this tool when you want a simple visual-response task with repeatable session summaries.
Useful for people who want a quick, browser-based way to measure response speed to one visual signal.
Good when you want to compare median results across the same device, input method, and sample size.
Best for short sessions where you want clear feedback without treating the result as a medical or safety assessment.
Each browser tool includes a result benchmark below the trainer. After a completed session, guests can compare the current setup with anonymous community completions or sessions saved in this browser. Signed-in users can choose Your results to compare account history. Use benchmarks as practical context, not as a medical, safety, or diagnostic score.
Benchmarks are grouped by matching tool settings, such as grid size, mode, difficulty, trial count, device context, and input method.
Community charts use completion metrics only. They do not include account details, email, or your local progress history.
Guests use sessions stored in this browser. Signed-in users can choose Your results to compare account history.
This is a simple visual reaction-time task. The screen waits for a random interval and then displays a clear visual signal. Your measured response time is the interval between that signal and your input.
The random delay makes it harder to predict the signal. Responding before it appears is treated as a false start rather than a valid result.
The result is a browser measurement, not a medical, neurological, driving-fitness, or professional performance assessment.
Use the median as the main session result and compare repeat sessions on the same setup.
| Metric | Meaning |
|---|---|
| Median | The middle result after your valid trial times are sorted |
| Average | The total of all valid trial times divided by the selected sample size |
| Fastest | Your quickest valid response |
| Response spread | The difference between your slowest and fastest result |
| False starts | Responses made before the visual signal |
One unusually slow trial can affect the average more strongly, while the median better represents the middle of the session.
The fastest result can be motivating, but it should not be treated as your normal reaction time.
One very slow or very fast response can distort your average. The median gives a steadier view of your session, especially when comparing repeated tests on the same device.
Average reaction time is useful context, but it is best read alongside the median and the full session conditions.
| Topic | Explanation |
|---|---|
| How average reaction time is calculated | The tool adds every valid measured trial and divides that total by your selected sample size. |
| Why the median appears first | The median is less affected by one unusually slow response, so it is usually the steadier session summary. |
| When the average is useful | Average reaction time can help compare repeat sessions when the device, browser, input method, and sample size stay the same. |
| What the average does not show | A browser average includes display and input latency, so it should not be treated as a medical, safety, sport, or gaming assessment. |
A shorter sample is faster, while a larger sample can make the average less dependent on one unusually quick or slow response. Keep the sample size the same when you compare sessions.
Browser-based reaction time includes both human response and technical delay.
The signal cannot appear until the display presents the updated frame.
Touchscreens, mice, keyboards, and pens can register input differently.
Different operating systems and hardware introduce different timing conditions.
Distraction, posture, hand position, and familiarity with the task can change a session.
Trying to predict the signal can produce false starts or unusually noisy results.
Compare repeated sessions on the same device and input method. Do not directly compare a touchscreen result with a mouse result as though the conditions were identical.
Repeat the test on the same phone or computer when comparing sessions.
Do not compare touch, mouse, and keyboard results as though they were interchangeable.
Begin each trial from a similar comfortable hand position.
Wait for the actual signal instead of trying to guess when it will appear.
Judge the session from the full configured sample rather than one unusually fast response.
Restart later if interruptions or repeated false starts make the session unreliable.
These tools involve different tasks, so their results should not be treated as interchangeable.
| Tool | Main task | Primary result |
|---|---|---|
| Reaction Time Test | Respond to one unpredictable visual signal | Response time in milliseconds |
| Visual Search Test | Find one target among similar distractors | Search time and accuracy |
| Schulte Table Trainer | Find a full ordered number sequence | Completion time and mistakes |
The Reaction Time Test focuses on responding to one signal. The Visual Search Test focuses on finding one target among distractors. A Schulte table requires repeated sequential searching across one grid.
A strong result in one tool does not automatically predict a strong result in the others.
Compare this one-signal response task with search and scanning exercises.
Visual Search Test
Find the target among distractors
Speed • Accuracy • Focus
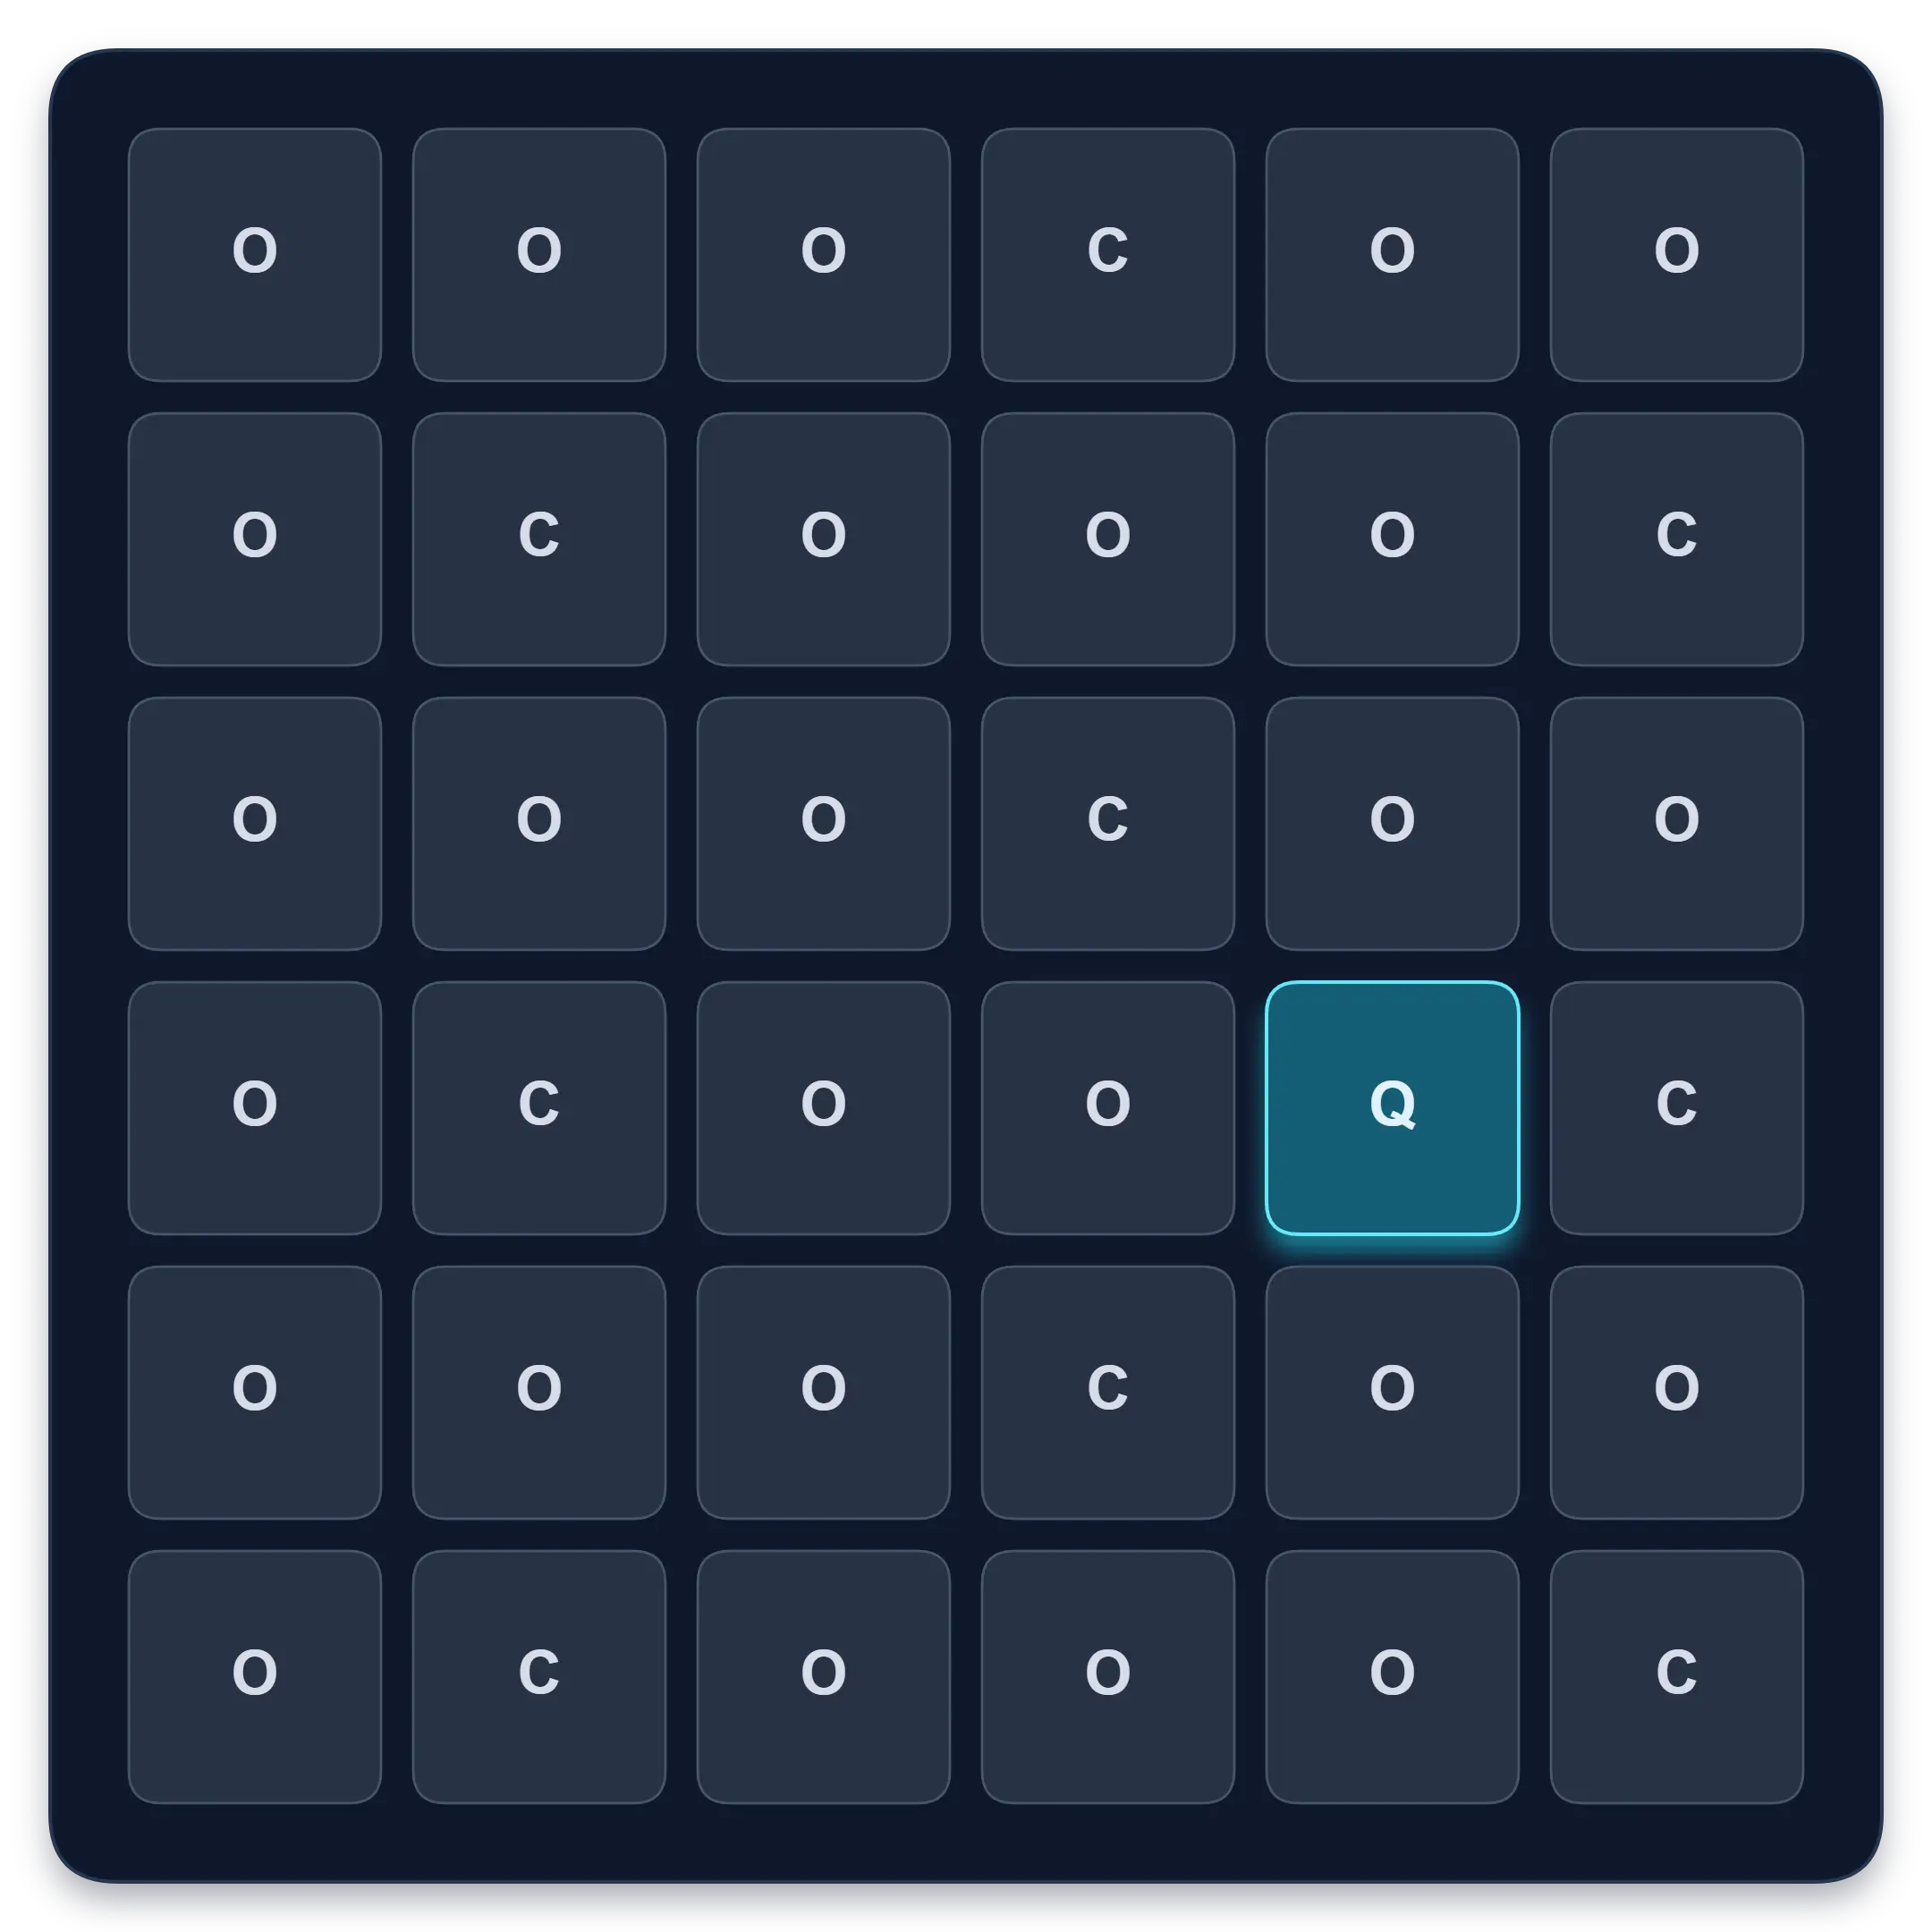
Goal: Faster target spotting with better accuracy
Find one target among similar symbols, letters, or numbers. Complete ten short rounds and track median response time, accuracy, and clean results.
Start Visual Search TestFree Schulte Table Trainer
Find the numbers in order
Focus • Scanning • Speed
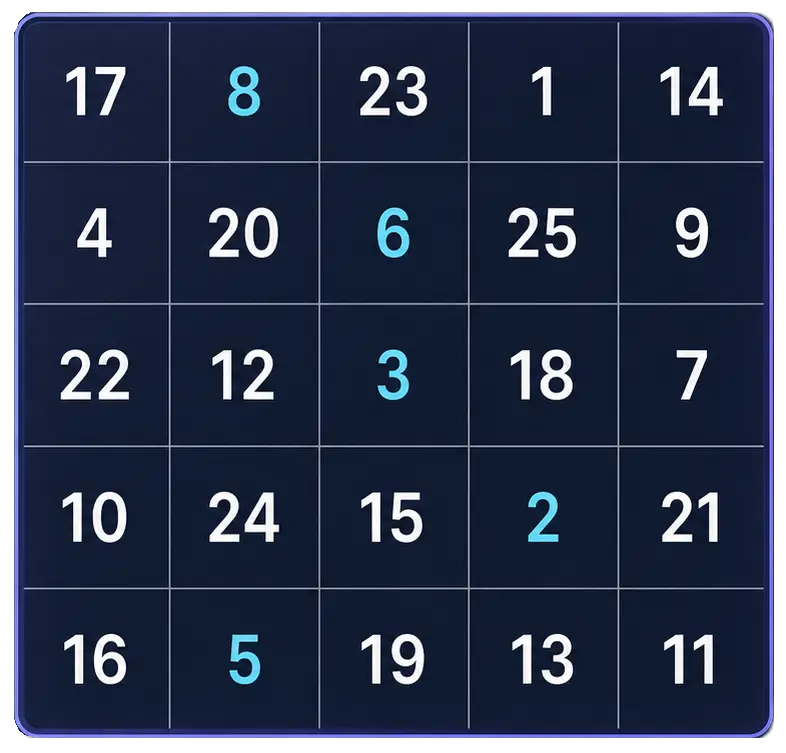
Goal: Cleaner 5x5 rounds with fewer mistakes
Practice Schulte tables online with a simple browser grid. Choose 3x3 through 7x7, track time and mistakes, and use pause, shuffle, and keyboard controls for quick focus sessions.
Start Free TrainerRead adjacent guides about focus measurement and visual-awareness practice.
Measure focus during work or study with a simple task log, quality checks and distraction notes. Try a worked example and learn what game scores cannot tell you.
Try a peripheral-awareness exercise, compare central and side-target accuracy, and learn why browser practice is not a clinical visual field test.
Use the app for structured Schulte practice and longer-term review.
Schulte table training with progress
History, heatmaps, pace, and weekly review
History • Heatmaps • Progress
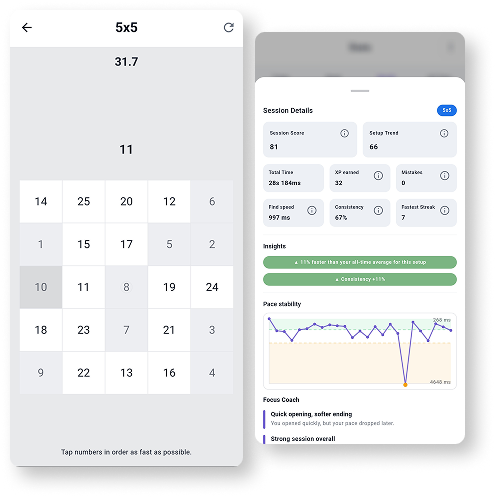
Train Schulte tables on Android with session history, pace patterns, heatmaps, achievements, and weekly progress review.
Explore Schulte TablesShort answers about browser reaction-time testing, result variation, false starts, and safe interpretation.
Reaction time is the interval between a stimulus appearing and a person beginning or completing a response. This browser test measures the time between a visual signal and your tap, click, or supported key press.
People sometimes call browser reaction tasks reflex tests, but this tool measures a voluntary response to a visual signal. It is not a clinical neurological reflex examination.
There is no single browser score that is universally good because results vary by device, display, input method, browser, and testing conditions. Use your median result and compare repeat sessions on the same setup.
Touchscreens, mice, displays, operating systems, and browsers can introduce different delays. Compare results only when the device and input method are similar.
Normal response variation, anticipation, distraction, hand position, and technical timing conditions can all affect individual trials. That is why the tool lets you use a configurable sample of valid trials instead of only one.
A response made before the visual signal is anticipation rather than a measured reaction. The trial is repeated and is not included in the result.
No. It is a recreational browser tool and must not be used to diagnose attention disorders, neurological conditions, eyesight problems, or fitness to drive.
Repeating the task may make you more familiar with its timing and controls, but this tool does not guarantee broader improvements in reaction speed, sports performance, gaming, or everyday safety.
Yes. Without an account, the tool stores up to 30 completed sessions per sample size, plus personal bests, in this browser. When you are signed in, supported result summaries are saved to your Quartenson account and appear in account history. Clear local history removes guest records stored in this browser.
Input latency varies by device and setup. The purpose of this tool is not to rank input hardware. Use one input method consistently when comparing your sessions.
After a completed session, the benchmark compares matching tool settings. The Community view uses anonymous aggregate results. Guests can use This device for sessions stored in this browser; signed-in users can choose Your results to load account history.
Quartenson uses only the result metrics needed for comparison, such as time, accuracy, mistakes, level, or clean trials. It does not use account details, email, or local history for the community chart.
A benchmark needs enough matching completions for the exact setup. If there is not enough data yet, the chart may be hidden until more matching results are available.