

Schulte Table Average Time (5×5): Median & Percentiles
Last updated 8 minutes to read
Quartenson 5×5 result distribution
This table shows aggregate completion-time percentiles from 1000+ matching Quartenson 5×5 rounds. It is designed to help you place a result in the correct mode, not to assign a score to a person. The figures refresh as eligible new results are aggregated.
| Mode | 25th percentile | Median (50th) | 75th percentile |
|---|---|---|---|
| Classic (stable grid) | 18.154 s | 23.518 s | 29.66 s |
| Dynamic (shuffle after a correct tap) | 29.249 s | 31.415 s | 34.101 s |
The 25th, 50th, and 75th percentiles describe the distribution of matching Quartenson results. Lower time is faster; compare only within the same mode and setup.
Result benchmark
Middle range
18.2 s–29.7 s
The central half of matching completions.
The curve is a percentile-based visual summary, not a histogram of raw results.
Check your 5×5 result
Complete a matching 5×5 round to see your result in context. Each eligible anonymous completion can also help Quartenson improve the mode-specific benchmark over time.
Try the free Schulte tableWhy Classic and Dynamic times are not comparable
Classic mode keeps the number layout stable throughout the round. Dynamic mode changes number positions after each correct selection, requiring renewed visual search on every tap. The observed medians therefore differ by design, not by a simple level of skill.
Use the same mode, grid size, device, and input method when tracking your own change. A 14-second Classic result and a 31-second Dynamic result do not belong on the same personal average.
For the mechanics in more detail, read Classic vs Dynamic Schulte Tables.
How to compare your own result
Use this article as a method guide, not a ranking table.
- Keep the same mode and 5×5 grid.
- Use the same device and input method where possible.
- Record several completed rounds and compare a median or typical result.
- Read mistakes alongside time; a clean round is easier to compare.
- Compare a recent matched set with your own earlier baseline.
Start with the free Schulte table trainer, then use the beginner Schulte table guide to establish a repeatable setup.
Methodology and limitations
This is a product-data summary, not a survey or clinical study.
- Source: Quartenson aggregate completion data for matching 5×5 rounds.
- Included: completed valid number-grid results with a recorded Classic or Dynamic mode.
- Classic keeps the grid stable; Dynamic shuffles positions after each correct selection. The modes are aggregated and displayed separately.
- The table uses the 25th percentile, median, and 75th percentile of completion time. Lower time is faster.
- Mistakes remain part of the recorded result and should be reviewed beside time when comparing personal rounds.
- Results are influenced by device, input method, layout, experience, and the exact implementation. Aggregate figures can change as new matching completions are added.
Use Quartenson aggregates as context for a matching setup, then rely on your own repeated sessions to evaluate personal progress. They are not a universal average, public ranking, or diagnostic measure.
Schulte table average-time FAQ
What is the average time for a 5×5 Schulte table?
Quartenson reports its current 5×5 completion-time distribution separately for Classic and Dynamic mode. Use the table above to see the current 25th percentile, median, and 75th percentile for a matching setup; these product-data results are context, not population norms.
Is Classic mode comparable with Dynamic mode?
No. Dynamic mode shuffles positions after each correct tap, while Classic mode keeps the grid stable. Track and compare each mode separately.
Is 30 seconds a good Schulte table time?
It depends on the mode and setup. Compare 30 seconds only with the matching Classic or Dynamic distribution, grid size, device, and input method shown above; the two modes should not share one benchmark.
Should mistakes be included?
Keep them in the record and review them beside time. For a cleaner personal comparison, also inspect zero-mistake sessions or use a consistent low-error rule.
How many sessions should I use for my personal average?
Start with several matched rounds, then compare the median or typical result rather than a single best time. Three to five calm rounds is a practical starting set.
Do Quartenson results represent a universal average?
No. They are aggregate results from matching Quartenson completions and can be affected by the product setup and its participants. Use them as context, then compare your own repeated sessions under the same conditions.
Check your 5×5 result
Complete a matching 5×5 round to see your result in context. Each eligible anonymous completion can also help Quartenson improve the mode-specific benchmark over time.
Try the free Schulte tableContinue learning
More Quartenson guides connected to this topic.
Classic vs Dynamic Schulte Tables
Classic and Dynamic Schulte tables are different exercises. Learn how shuffle mode changes the task, when to use each mode, and why results should not be compared directly.
How to Improve Schulte Table Time
Use practical drills to reduce pauses, avoid rushing, compare clean 5×5 results, and improve your Schulte table time with a structured 14-day plan.
How to Use Schulte Tables Correctly
Learn the correct Schulte table routine for beginners: choose a grid size, practise clean 5×5 rounds, avoid rushing, and track time with accuracy.
Track Schulte Table Progress
Learn how to track Schulte table progress with clean median time, mistakes, consistency spread, personal bests, and recent history instead of relying only on one fastest result.
Try a free tool
Practice the same ideas with a browser-based exercise.
Free Schulte Table Trainer
Find the numbers in order
Focus • Scanning • Speed
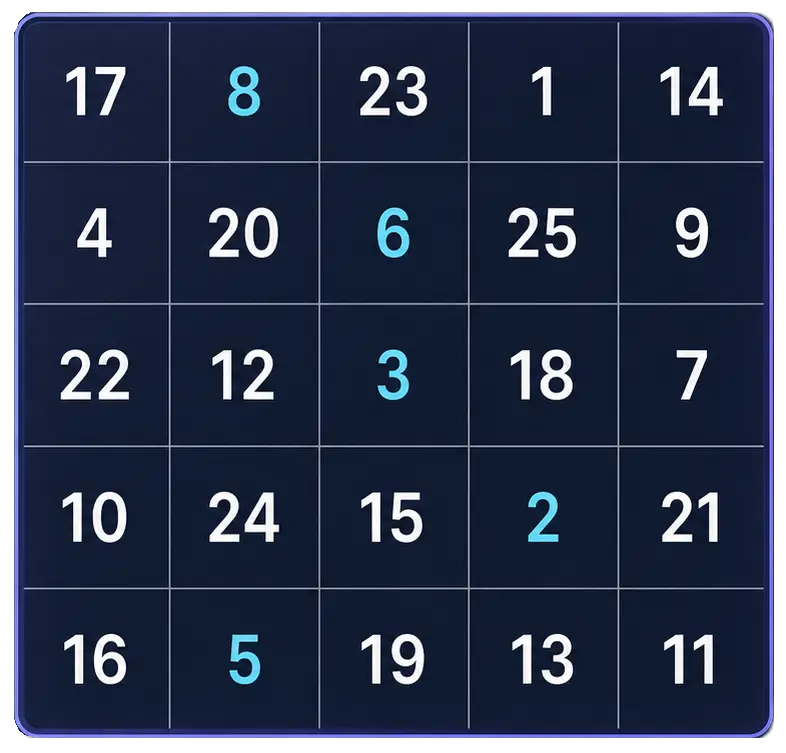
Free Schulte Table Trainer
Browser toolGoal: Cleaner 5x5 rounds with fewer mistakes
Practice Schulte tables online with a simple browser grid. Choose 3x3 through 7x7, track time and mistakes, and use pause, shuffle, and keyboard controls for quick focus sessions.
Start Free TrainerReaction Time Test
Respond to one visual signal
Median • Fastest • Spread
Reaction Time Test
Browser toolGoal: Response-speed measurement for one visual signal
Wait for an unpredictable visual signal, then respond as quickly as you can. Choose 1 to 10 trials and review your median, average, fastest time, and false starts.
Test Reaction TimeContinue in the app
Use the app when you want structured sessions and longer-term tracking.
Schulte table training with progress
History, heatmaps, pace, and weekly review
History • Heatmaps • Progress
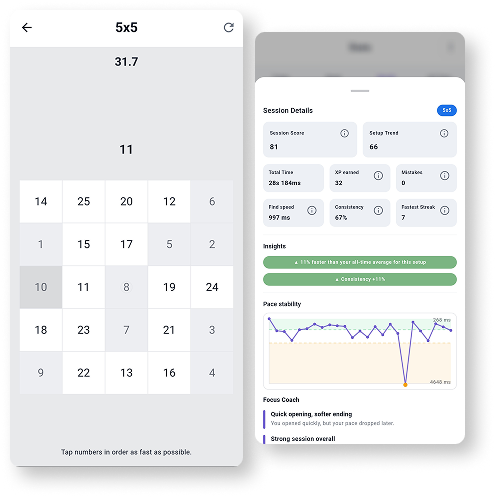
Quartenson: Schulte Tables
Available nowTrain Schulte tables on Android with session history, pace patterns, heatmaps, achievements, and weekly progress review.
Explore Schulte Tables